Matlab GUI Design: popupmenu

Contents
In last part, we introduced how to add an axes to plot a graph of sine function. Here we will describe that colors can be chosen in popup menu to change the color of curves.
1 Add a poppup menu on the GUI app
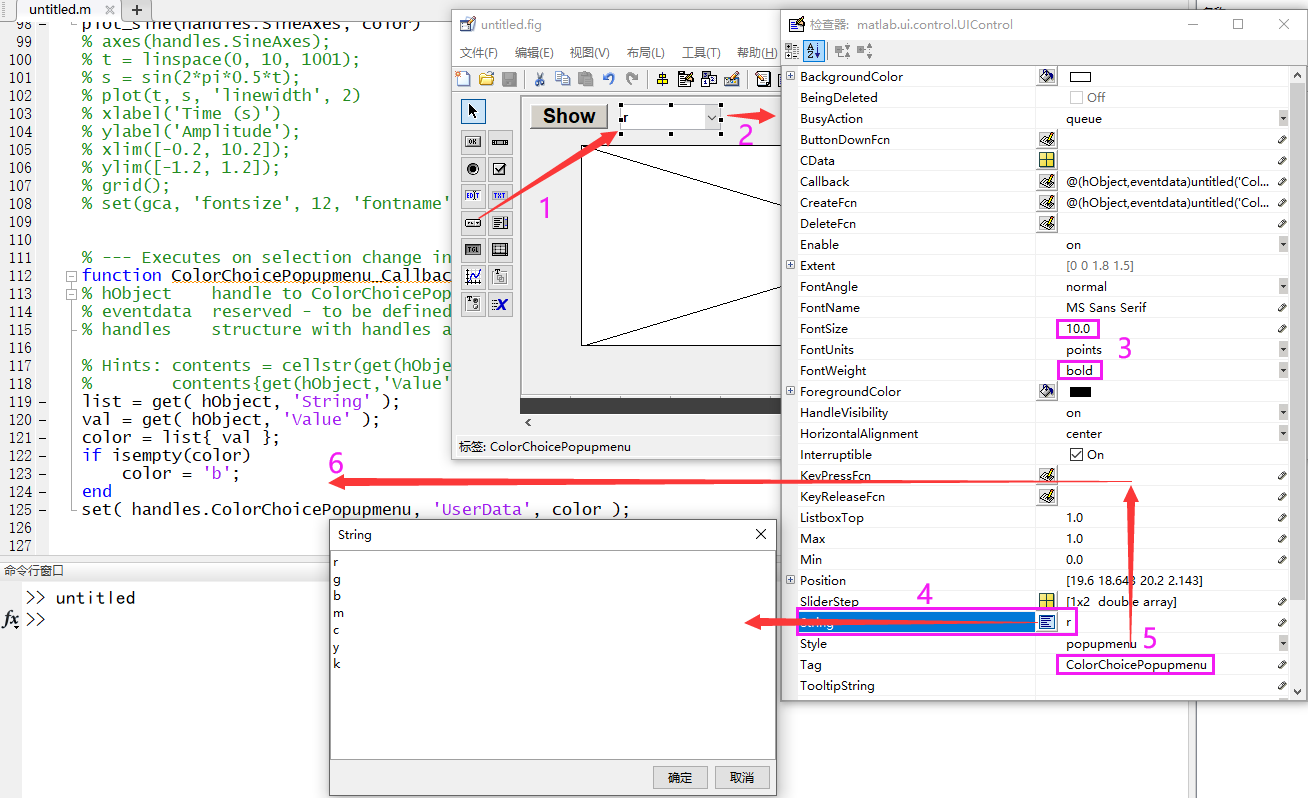
We firstly, as usual, add a popup menu on the GUI app with the guide tool. The following procedures show the way of implementing a popup menu.
-
1 Click the popup menu widget to add it on our app;
-
2 Double-click on the popupmenu to call the setting interface;
-
3 Modify some settings, e.g. font size, weight, color;
-
4 double-click on the
Stringto call the value interface, and you can add some color names in the list; -
5 Modify the
Tagto locate the callback function of the popup menu inmfile; -
6 Obtain the chosen value when you choose some color, and two lines should be added to do it.
1
2
3
list = get( hObject, 'String' ); % Get the listof all strings. val = get( hObject, 'Value' ); % Get the index of the chosen string. color = list{ val }; % Get the chosen string.
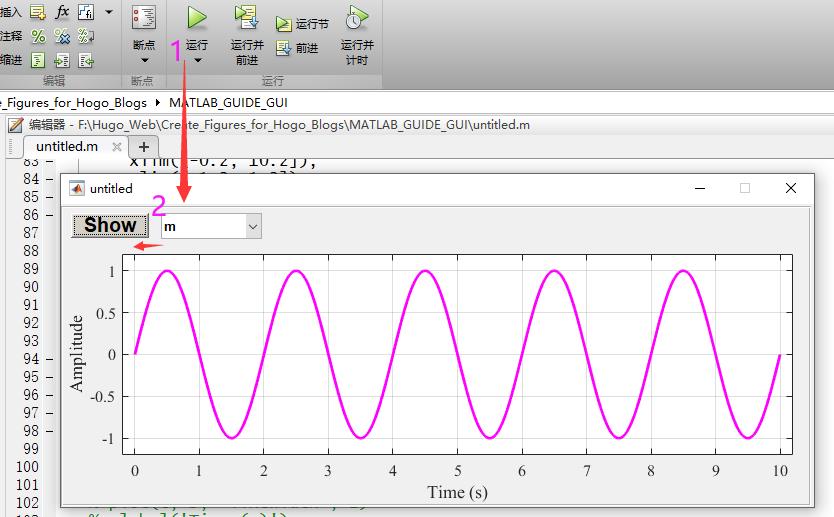
2 Run the app
- 1 Run the
mfile; - 2 Choose a color to plot the sine function.
Author Geophydog
LastMod 2021-01-06