Matlab GUI Design: axes

Contents
1 Add an axes on the GUI app
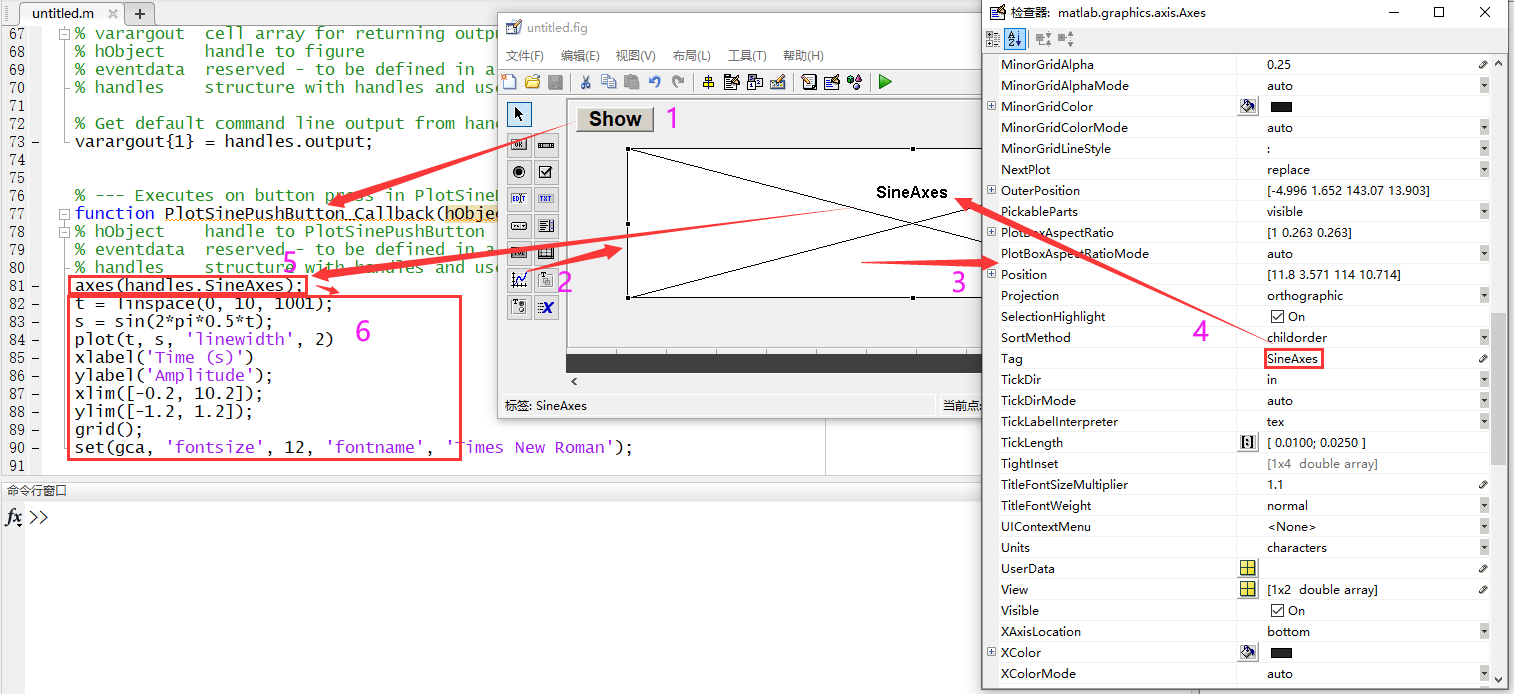
We introduced how to add a button on a MATLAB GUI app in the previous part. Here we will show that how to plot the graph of a sine function on the app, and we suppose that you have created a guide file. We need to add an axes on the app before we implement plotting a sine function.
- 1 Add a button (see the previous part);
- 2 Add an axes;
- 3 Double-click on the axes to call the axes setting interface;
- 4 Set the axes name;
- 5 Go and implement the callback function of the button;
- 6 The specific codes of plotting a sine function.
One can note that we need to get the axes before we plot the sine function, and the code is
axes( handles.SineAxes);.
2 Run this app and plot a sine function
We need run the MATLAB GUI file if we want to plot the sine function.
- 1 Run
untitled.m; - 2 Press
Showbutton; - 3 The sine function will be shown.
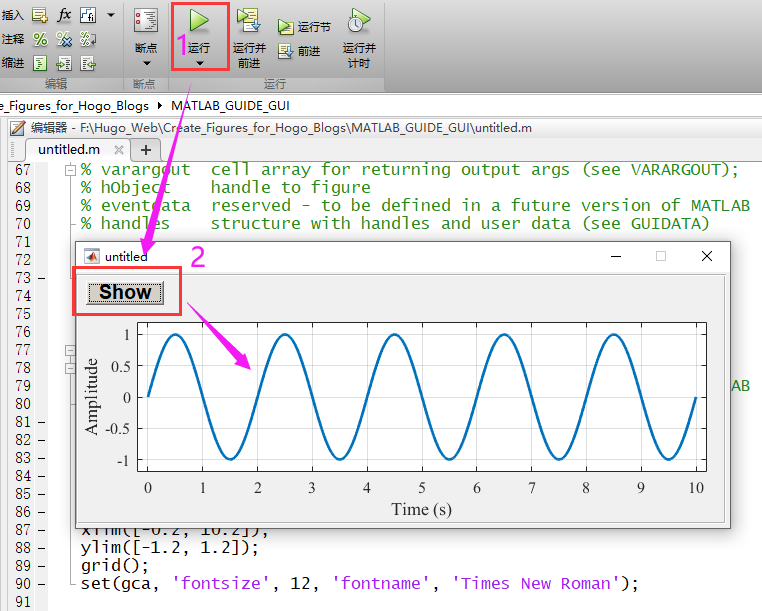
Adding an axes to plot is very simple, isn’t it?
Author Geophydog
LastMod 2021-01-02