  1
  2
  3
  4
  5
  6
  7
  8
  9
 10
 11
 12
 13
 14
 15
 16
 17
 18
 19
 20
 21
 22
 23
 24
 25
 26
 27
 28
 29
 30
 31
 32
 33
 34
 35
 36
 37
 38
 39
 40
 41
 42
 43
 44
 45
 46
 47
 48
 49
 50
 51
 52
 53
 54
 55
 56
 57
 58
 59
 60
 61
 62
 63
 64
 65
 66
 67
 68
 69
 70
 71
 72
 73
 74
 75
 76
 77
 78
 79
 80
 81
 82
 83
 84
 85
 86
 87
 88
 89
 90
 91
 92
 93
 94
 95
 96
 97
 98
 99
100
101
102
103
104
105
106
107
108
109
110
111
112
113
114
|
import numpy as np
import matplotlib.pyplot as plt
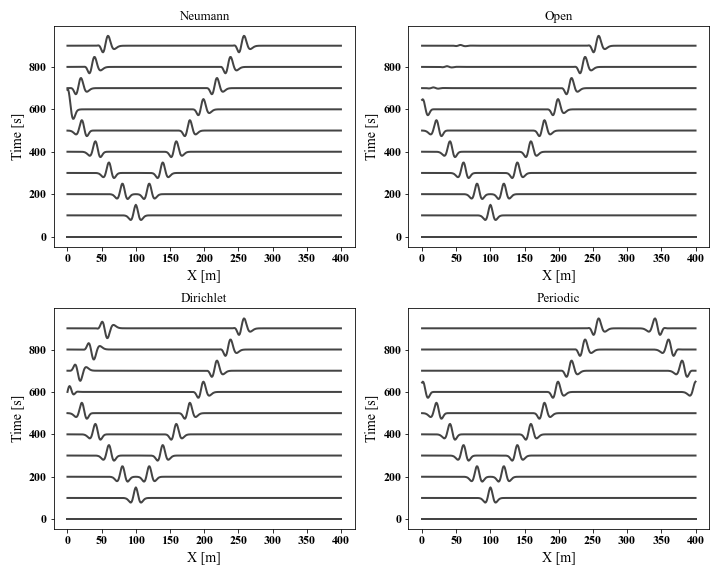
def aco_wave_1d(nt, dt, nx, dx, sx, f0, t0, c, bc='Open'):
t = np.arange(nt) * dt
x = np.arange(nx) * dx
s = (1-2*(np.pi*f0*(t-t0))**2) * np.exp(-(np.pi*f0*(t-t0))**2)
p = np.zeros((nt, nx))
for i in range(1, nt-1):
for j in range(1, nx-1):
if j == sx:
p[i+1, j] = s[i]
else:
p[i+1, j] = 2*p[i, j] - p[i-1, j] + (c*dt/dx)**2 * (p[i, j+1]-2*p[i, j]+p[i, j-1])
if bc == 'Neumann':
p[i+1, 0] = p[i+1, 1]; p[i+1, nx-1] = p[i+1, nx-2]
elif bc == 'Open':
p[i+1, nx-1] = p[i+1, nx-2] - (p[i+1, nx-2]-p[i, nx-2]) * dx / dt / c
p[i+1, 0]= p[i+1, 1]- (p[i+1, 1]- p[i, 1]) * dx / dt / c
elif bc == 'Periodic':
p[i+1, nx-1] = p[i+1, 1]
p[i+1, 0]= p[i+1, nx-2]
else:
pass
return x, t, p
def main():
f0 = 10; t0 = 0.1
nt = 1001; dt = 1e-3
c = 200.; nx = 401
dx = 1; sx = nx // 4
# Neumann boundary condition
bc1 = 'Neumann'
x, t, p1 = aco_wave_1d(nt, dt, nx, dx, sx, f0, t0, c, bc=bc1)
# Open boundary condition
bc2 = 'Open'
_, _, p2 = aco_wave_1d(nt, dt, nx, dx, sx, f0, t0, c, bc=bc2)
# Dirichlet boundary condition
bc3 = 'Dirichlet'
_, _, p3 = aco_wave_1d(nt, dt, nx, dx, sx, f0, t0, c, bc=bc3)
# Periodic boundary condition
bc4 = 'Periodic'
_, _, p4 = aco_wave_1d(nt, dt, nx, dx, sx, f0, t0, c, bc=bc4)
# Plot
nt = len(p1[:, 0]); tn = 10; tt = nt // tn
plt.figure(figsize=(10, 8))
plt.subplot(221)
for i in range(tn):
d = p1[i*tt] * 50
plt.plot(x, d+i*tt, lw=2, color='#444444')
plt.ylabel('Time [s]', fontsize=14)
plt.xlabel('X [m]', fontsize=14)
plt.xticks(fontsize=12)
plt.yticks(fontsize=12)
plt.title(bc1, fontsize=13)
plt.subplot(222)
for i in range(tn):
d = p2[i*tt] * 50
plt.plot(x, d+i*tt, lw=2, color='#444444')
plt.ylabel('Time [s]', fontsize=14)
plt.xlabel('X [m]', fontsize=14)
plt.xticks(fontsize=12)
plt.yticks(fontsize=12)
plt.title(bc2, fontsize=13)
plt.subplot(223)
for i in range(tn):
d = p3[i*tt] * 50
plt.plot(x, d+i*tt, lw=2, color='#444444')
plt.ylabel('Time [s]', fontsize=14)
plt.xlabel('X [m]', fontsize=14)
plt.xticks(fontsize=12)
plt.yticks(fontsize=12)
plt.title(bc3, fontsize=13)
plt.subplot(224)
for i in range(tn):
d = p4[i*tt] * 50
plt.plot(x, d+i*tt, lw=2, color='#444444')
plt.ylabel('Time [s]', fontsize=14)
plt.xlabel('X [m]', fontsize=14)
plt.xticks(fontsize=12)
plt.yticks(fontsize=12)
plt.title(bc4, fontsize=13)
plt.tight_layout()
plt.show()
if __name__ == '__main__':
main()
|