Basemap in Python

Contents
1 Installation
Here, the platforms are windows 10 and Anaconda-3.5.3.0 (Python 3.7).
- Open anaconda prompt type
pip install geosto install librarygeos; - Go
https://www.lfd.uci.edu/~gohlke/pythonlibs/to download two libraries:pyproj‑2.6.1.post1‑cp37‑cp37m‑win_amd64.whlandbasemap‑1.2.2‑cp37‑cp37m‑win_amd64.whl - Type commands:
pip install pyproj‑2.6.1.post1‑cp37‑cp37m‑win_amd64.whlandpip install basemap‑1.2.2‑cp37‑cp37m‑win_amd64.whl
Now, we’ve installed Basemap and enjoy it!
2 The First Basemap
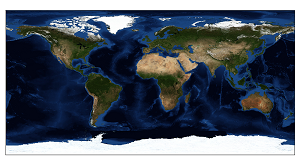
2.1 Satellite map
|
|
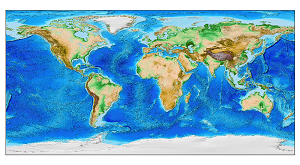
2.2 Elevation model: etopo
|
|
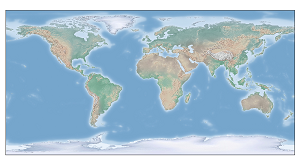
2.3 Shadedrelief
|
|
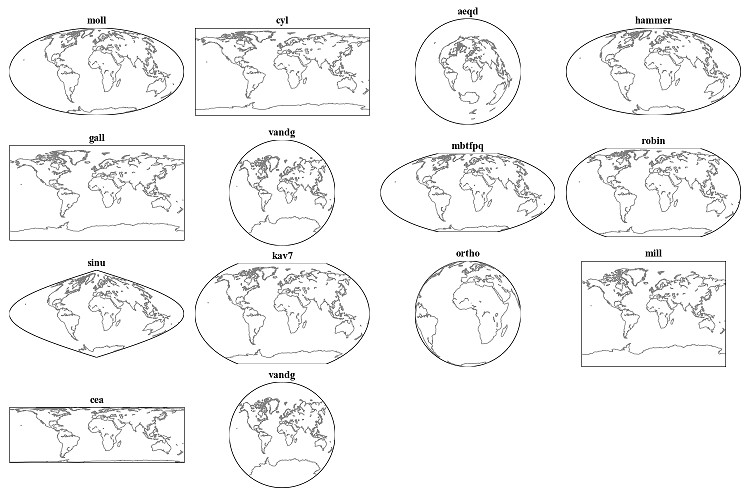
3 Projections
3.1 Global range of the Earth
|
|
Author Geophydog
LastMod 2020-09-12