1 The first animation

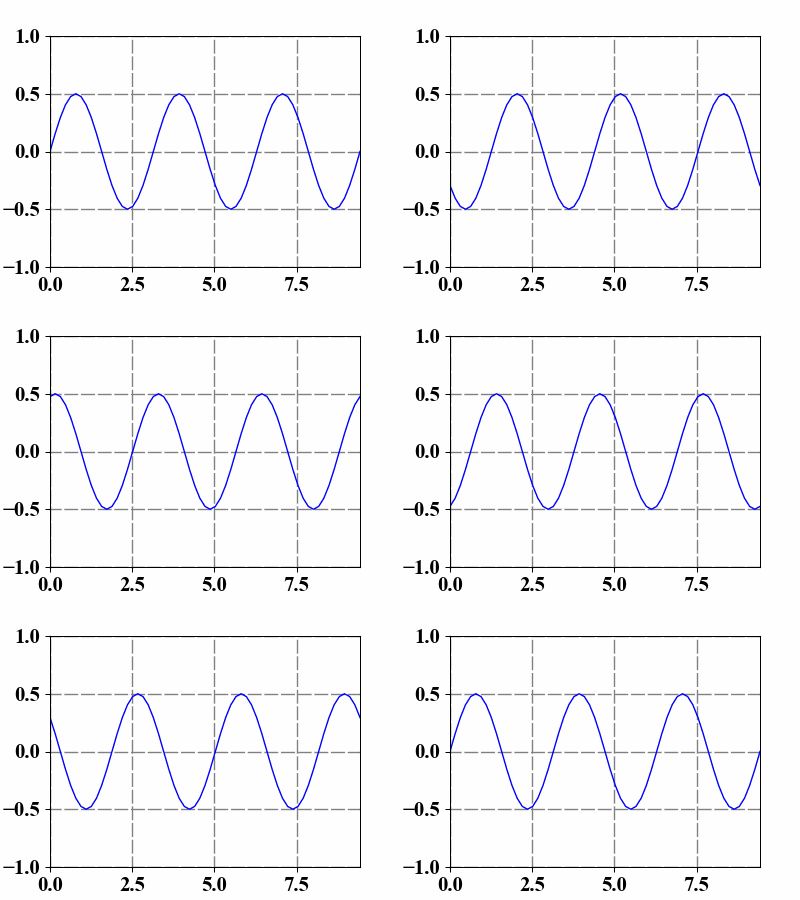
Making animations using Python is very convenient and here we first implement the propagation of a sine or cosine function;

 1
 2
 3
 4
 5
 6
 7
 8
 9
10
11
12
13
14
15
16
17
18
19
20
import numpy as np
import matplotlib.pyplot as plt
from matplotlib import animation

t = np.linspace(0, 3*np.pi, 61)
s = np.sin(t)
fig = plt.figure(figsize=(6, 3))
line, = plt.plot(t, s, 'b', lw=2)
  
def animate(theta):
    s = np.sin((t-theta)*2) * 0.5
    line.set_data(t, s)
    return line,

ani = animation.FuncAnimation(fig, animate,
                    frames=np.linspace(0, 2*np.pi, 51),
                    interval=100, blit=True)
plt.xlim(t[0], t[-1]); plt.ylim(-1, 1)
plt.grid(ls=(2, (10, 2)), lw=1, color='gray')
plt.box('off')

Single Sine

2 How to save the animation

Use writergif = animation.PillowWriter(fps=25); ani.save('Sine.gif', writer=writergif) to save this animation if necessary.

3 Data point pursuing

 1
 2
 3
 4
 5
 6
 7
 8
 9
10
11
12
13
14
15
16
17
18
19
20
21
22
23
import numpy as np
import matplotlib.pyplot as plt
from matplotlib import animation


x0 = 1.5
t = np.linspace(0, 2*np.pi, 61)
s = np.sin(t) * 0.5
fig = plt.figure(figsize=(6, 3))
plt.plot(t, s, lw=2, c='gray')
line, = plt.plot(0, 0, 'ro')
  
def animate(i):
    x = t[i]
    y = s[i]
    line.set_data(x, y)
    return line,

ani = animation.FuncAnimation(fig, animate,
                    frames=np.arange(len(t)),
                    interval=50, blit=True)
plt.xticks([]); plt.yticks([])
plt.box('off')

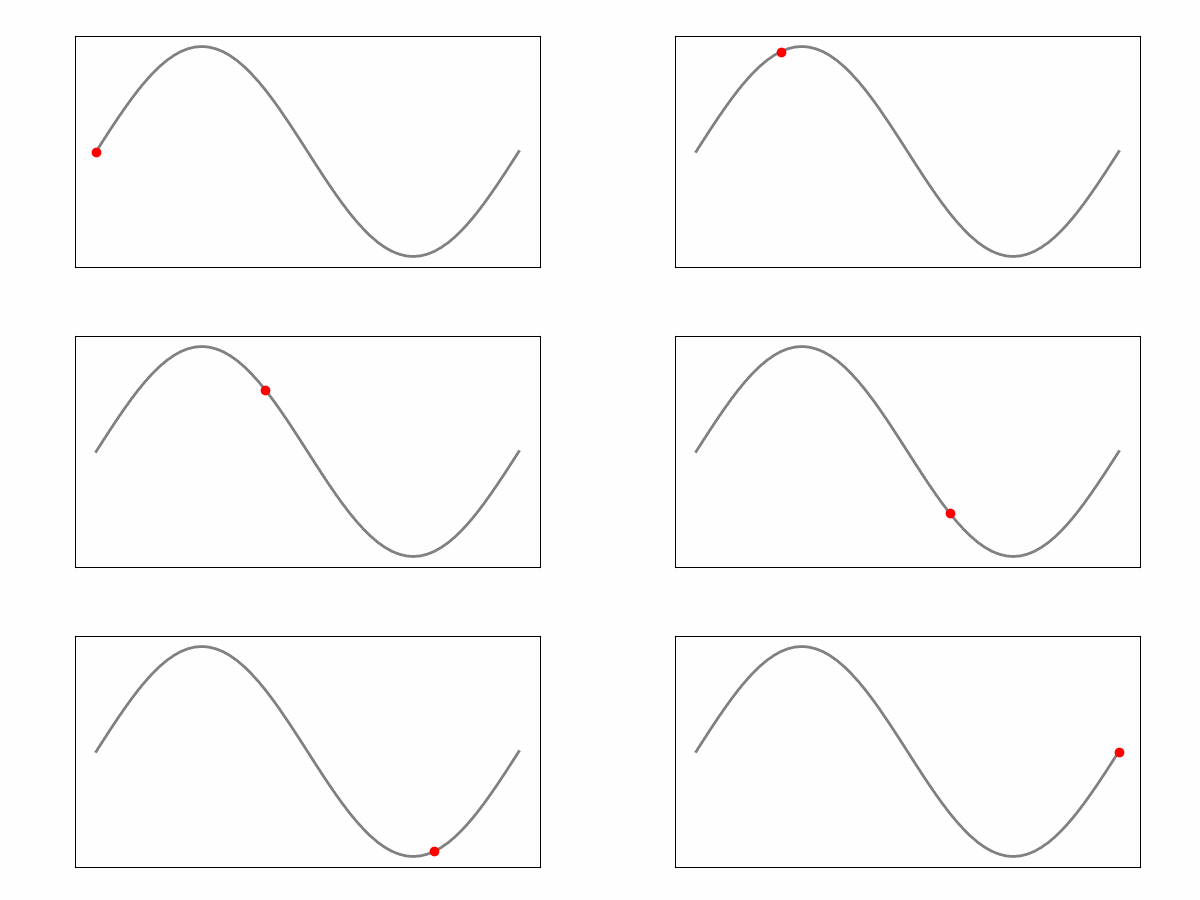
Searching

4 Add more lines__

 1
 2
 3
 4
 5
 6
 7
 8
 9
10
11
12
13
14
15
16
17
18
19
20
21
22
23
24
25
26
import numpy as np
import matplotlib.pyplot as plt
from matplotlib import animation

t = np.linspace(0, 5*np.pi, 101)
s = np.sin(t)
fig = plt.figure(figsize=(6, 3))
ln1, = plt.plot(t, s, 'b', lw=0.5)
ln2, = plt.plot(t, s, 'r', lw=0.5)
ln3, = plt.plot(t, s, 'g', lw=0.5)
  
def animate(theta):
    s1 = np.sin((t-2*theta)*3) * 0.25
    s2 = np.sin((t-4*theta)*2) * 0.50
    s3 = np.sin((t-6*theta)*1) * 0.75
    ln1.set_data(t, s1)
    ln2.set_data(t, s2)
    ln3.set_data(t, s3)
    return ln1, ln2, ln3,

ani = animation.FuncAnimation(fig, animate,
                    frames=np.linspace(0, 2*np.pi, 51),
                    interval=100, blit=True)
plt.xlim(t[0], t[-1]); plt.ylim(-1, 1)
plt.grid(ls=(2, (10, 2)), lw=1, color='gray')
plt.box('off')

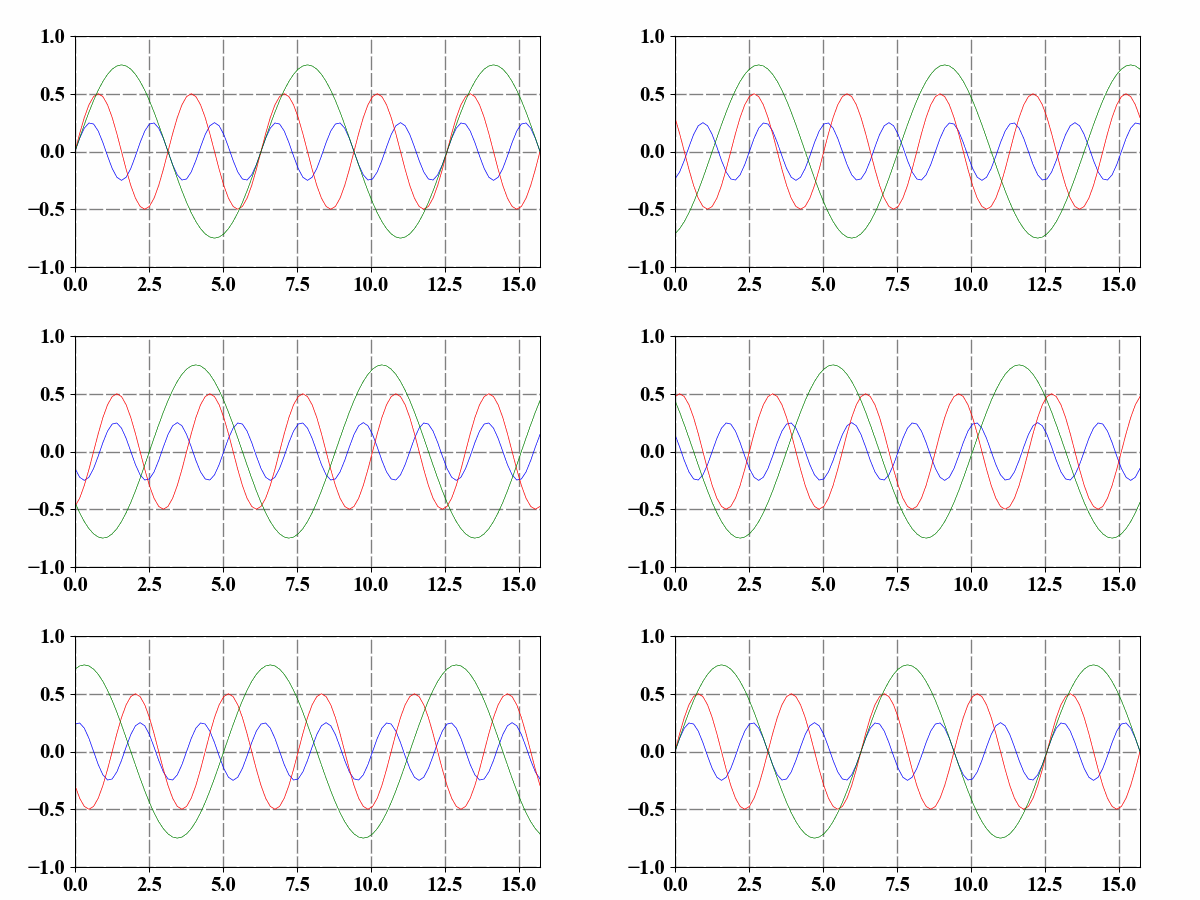
Tri Sine

5 Simulating a clock__

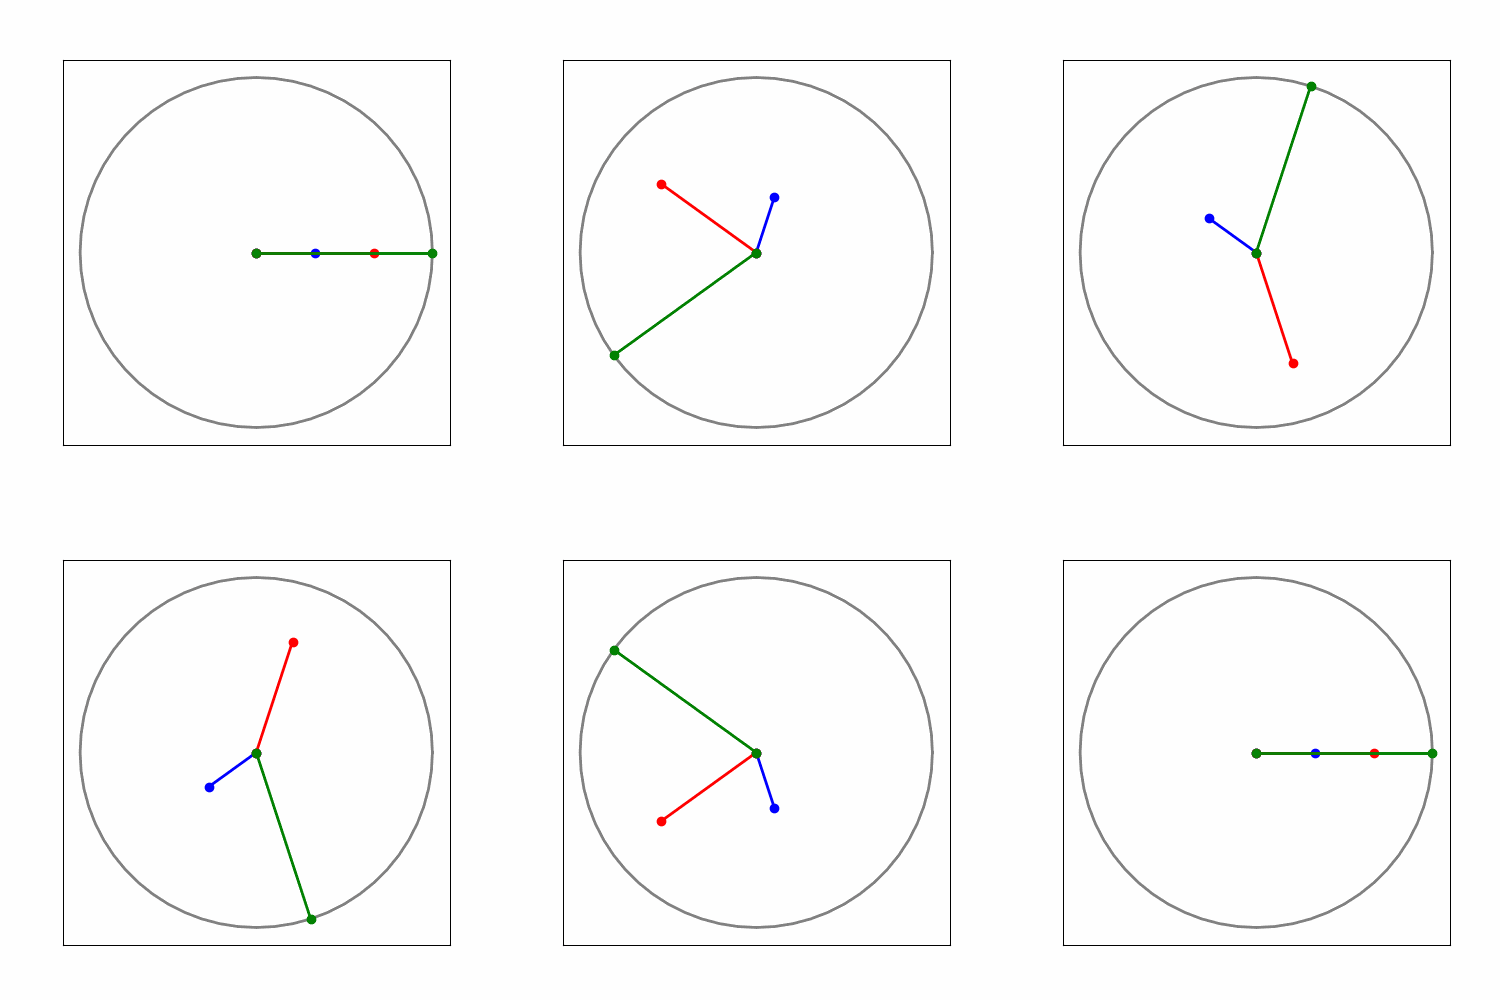
Let’s give you a simple demo which simulates a clock. Enjoy it!

 1
 2
 3
 4
 5
 6
 7
 8
 9
10
11
12
13
14
15
16
17
18
19
20
21
22
23
24
25
26
27
28
29
30
31
32
import numpy as np
import matplotlib.pyplot as plt
from matplotlib.animation import FuncAnimation


x0 = 1.5
t = np.linspace(0, 2*np.pi, 201)
x = np.cos(t); y = np.sin(t)
fig = plt.figure(figsize=(2, 2))
plt.plot(x, y, lw=3, c='gray')
ln1, = plt.plot([], [], 'b-o', lw=2)
ln2, = plt.plot([], [], 'r-o', lw=1.5)
ln3, = plt.plot([], [], 'g-o', lw=1)
ax = plt.gca()
ax.spines['top'].set_visible(False)
ax.spines['bottom'].set_visible(False)
ax.spines['left'].set_visible(False)
ax.spines['right'].set_visible(False)

def animate(theta):
    x1 = np.cos(theta) * 0.3;   y1 = np.sin(theta) * 0.3
    x2 = np.cos(2*theta) * 0.6; y2 = np.sin(2*theta) * 0.6
    x3 = np.cos(3*theta);       y3 = np.sin(3*theta)
    ln1.set_data([0, x1], [0, y1])
    ln2.set_data([0, x2], [0, y2])
    ln3.set_data([0, x3], [0, y3])
    return ln1, ln2, ln3,

ani = FuncAnimation(fig, animate,
                    frames=np.linspace(0, 2*np.pi, 91),
                    interval=20, blit=True)
plt.xticks([]); plt.yticks([])

animation