 1
 2
 3
 4
 5
 6
 7
 8
 9
10
11
12
13
14
15
16
17
18
19
20
21
22
23
24
25
26
27
28
29
30
31
32
33
34
35
36
37
38
39
40
41
42
43
44
45
46
47
48
49
50
51
52
53
54
55
56
57
58
59
60
61
62
63
64
65
66
67
68
69
70
71
|
import numpy as np
import matplotlib.pyplot as plt
from obspy import read
from scipy import fft
from scipy.signal import butter, filtfilt
def bandpass(d, fs, f1, f2, order=4, zerophase=False, taper=0.01):
n = len(d)
f = np.arange(n) * fs / n
w = 2 * np.pi * f / fs
z = np.exp(1j*w)
w1 = 2 * np.pi * f1 / fs
w2 = 2 * np.pi * f2 / fs
k = np.arange(2*order)
if order % 2 == 0:
q = np.exp(1j*(k+0.5)/order*np.pi)
else:
q = np.exp(1j*k/order*np.pi)
q1 = np.tan(w1/2) * q
p1 = (1 + q1) / (1 - q1)
h1 = np.ones_like(w, dtype=complex)
for pp in p1[abs(p1)<1]:
h1 *= ((1+pp) / (1-pp/z))
h1 *= ( (1-1/z) ** order / 2**order )
q2 = np.tan(w2/2) * q
p2 = (1 + q2) / (1 - q2)
h2 = np.ones_like(w, dtype=complex)
for pp in p2[abs(p2)<1]:
h2 *= ((1-pp) / (1-pp/z))
h2 *= ( (1+1/z) ** order / 2**order )
h = h1 * h2
dd = fft.ifft(fft.fft(d) * h).real
if zerophase:
dd = fft.ifft(fft.fft(dd[::-1]) * h)[::-1].real
ni = int(n*taper)
k1 = np.arange(ni)
k2 = np.arange(-ni, 0)
ta1 = np.cos(k1*np.pi/2/ni) ** order
ta2 = np.cos(k2*np.pi/2/ni) ** order
dd[:ni] *= ta2; dd[-ni:] *= ta1
return f, h, dd
def main():
tr = read()[0]
tr.data -= np.mean(tr.data)
tr.detrend(); tr.taper(0.01)
d1 = tr.data.copy(); dt = tr.stats.delta; fs = 1 / dt
n = len(d1); t = np.arange(n) * dt
f1 = 1.5; f2 = 2.5; N = 4
d1 = tr.data.copy()
f, h, d2 = bandpass(d1, fs, f1, f2, order=N, zerophase=1, taper=0.01)
f, h, d4 = bandpass(d1, fs, f1, f2, order=N**2, zerophase=1, taper=0.01)
[b, a] = butter(N, [2*f1/fs, 2*f2/fs], 'bandpass')
d3 = filtfilt(b, a, d1)
plt.figure(figsize=(8, 6))
plt.subplot(211)
plt.plot(t, d2, 'r', lw=2, label='this')
plt.plot(t, d3, 'b', lw=1, label='scipy')
plt.legend(fontsize=15)
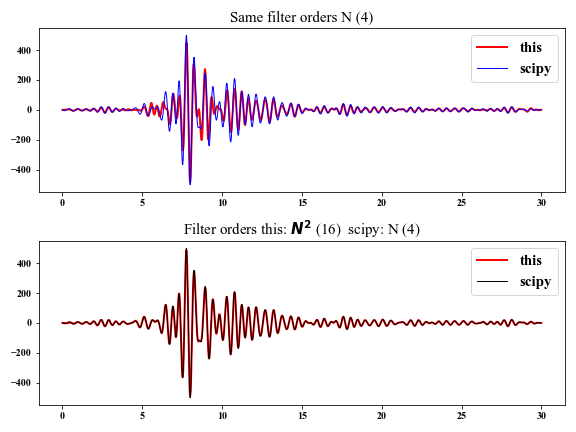
plt.title('Same filter orders N (4)', fontsize=15)
plt.subplot(212)
plt.plot(t, d4, 'r', lw=2, label='this')
plt.plot(t, d3, 'k', lw=1, label='scipy')
plt.legend(fontsize=15)
plt.title('Filter orders this: $N^2$ (16) scipy: N (4)', fontsize=15)
plt.tight_layout()
plt.show()
if __name__ == '__main__':
main()
|